
Digitizing accuracy is reflected in the RMS error value that Didger reports in the calibration process. When a non-georeferenced image is imported into Didger, the Image Registration and Warping dialog appears. For an RMS error to be calculated, image calibration requires at least four points. After calibrating the image, the Total RMS value appears in the lower right of the Calibration Points section.
If an image is already imported into the project, or if a georeferenced image is imported, you can view the Total RMS by selecting the image, going to Image | Image Registration and Warping. The Total RMS value appears in the lower right of the Calibration Points section.
When you type calibration point coordinates into the calibration grid, Didger determines where the exact or expected point locations should be in relation to the tablet’s coordinate system or in relation to the image pixels.
However, there is a degree of error inherent in the process of digitizing calibration points. When you actually digitize the points, Didger determines the difference between the digitized locations and the expected locations. This difference is reported as an error value for each calibration point. The RMS value is simply the standard deviation based on all the error values. An RMS value is determined using the equation
where
x = a digitized location
t = the true (or expected) location
n = the number of digitized calibration points
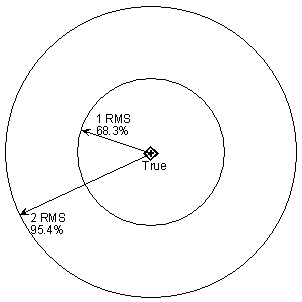
This graphic illustrates the relationship between a point’s true location and
the probability that a digitized point will be within a certain distance of the true
location. For example, there is a 68.3% chance that a digitized point would
lie somewhere within the smaller circle around the true point location.
As stated previously, RMS values are simply standard deviation values, and are in the units you use for your calibration coordinates (feet, meters, miles, kilometers, and so on). Because of this, you can think of RMS values as distances. In this discussion, they are often referred to as the RMS distance rather than RMS value or RMS error.
In Didger, we assume that all digitizing errors are random. This means that when you digitize a point it has an equal chance of lying in any direction from the true point location (a normal distribution). Statistics tell us that with this type of data distribution (a normal distribution), a certain percentage of observations can be expected to lie within a particular number of standard deviations from the mean. In Didger, this means that a certain percentage of points lie within a certain number of RMS distances from their true location. For example, we can say that there is a 68.3 percent chance that a digitized point lies within one RMS distance of its true location.
What does this mean in simple language? How far away is the digitized location from the true location? When you digitize a point, the digitized location is probably not exact. You cannot determine how far away it actually is, but you can say there is a percentage chance that it is within a given distance from the true location by using a standard normal probability table. It can be stated that a point has some percent chance of being a certain distance from its true location, or that a certain percentage of points lie within a certain distance of their true location. Here is a short probabilities table giving you an idea of several percentages assigned to numbers of RMS distances.
|
Within this Distance |
Chance of Occurrence |
|
(0.5)*RMS distance |
38.3% |
|
(1.0)*RMS distance |
68.3% |
|
(1.5)*RMS distance |
86.6% |
|
(2.0)*RMS distance |
95.4% |
|
(2.5)*RMS distance |
98.8% |
|
(3.0)*RMS distance |
99.7% |
This table shows how to use the RMS values to determine the chances that a digitized point will lie within a certain distance from its true location. If we take the first row of the table as an example, it shows that there is a 38.3 percent chance that a digitized point will lie within one-half of the RMS distance (0.5*RMS distance) of its true location. So, if your project uses feet for units, and the RMS value is 10, there is a 38.3 percent chance that a digitized point lies within 5 feet of the true location (0.5*10). Alternatively, assume a project RMS is calculated to be 16.40. Another way of using these RMS values is to say that 99.7 percent of all digitized points lie within 49.20 units of their true locations (3*RMS distance or 3.0 * 16.40 = 49.20).
See Also
Digitizing Accuracy and Acceptable Error
Calculating Allowable or Acceptable RMS Error