Drawing the Monitoring Wells - Tutorial
First, let’s create the monitoring wells  . You can associate the well names and the groundwater elevation values with each point as you create it or select all of the wells and add the labels later. The names and symbols can also be assigned before or after the wells are created. Because the monitoring wells use sequential IDs, we can use the auto increment options to define the IDs.
To auto increment the well IDs:
-
Click the Draw | Symbol command or click the  button.
-
In the Property Manager, click the  next to the Increment Settings section.
-
Check the box next to the Enter Data After Creation option, so the groundwater elevation values for each point can be added as the symbol is created.
-
Uncheck the box next to the Create Several option. This option is used when IDs are not automatically incremented.
-
Check the box next to the Auto Increment box. This option is used when IDs are automatically incremented.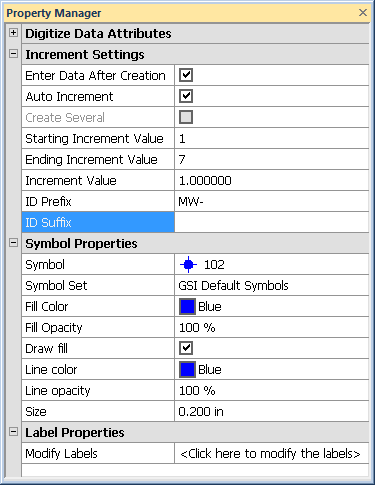
-
Highlight the existing value next to the Starting Increment Value option. Type 1 and press ENTER on the keyboard to make the change.
-
Highlight the existing value next to the Ending Increment Value option. Type 7, and press ENTER on the keyboard to make the change.
-
The Increment Value should already be 1. If it is not 1, highlight the existing value and type 1. Press ENTER on the keyboard to make the change.
-
Highlight the text next to the ID Prefix option. Type MW- for the label prefix.
-
Highlight the text next to the ID Suffix option. Press the DELETE key on the keyboard so that the suffix is empty.
To set the symbol properties before creating the symbols:
-
Click the next to the Symbol Properties section.
-
Make sure the Symbol Set is set to GSI Default Symbols. If the symbol set is not set to GSI Default Symbols, click on the current symbol set name and click on GSI Default Symbols in the list.
-
Click on the current Symbol to open the symbol palette and click on the symbol (symbol 102) to select it.
-
Click on the current Fill Color to open the color palette and click on the color Blue to select it.
-
To change the outside line color of the symbol, click on the current Line color and click on the color Blue to select it. Now both the outside and inside of the symbol will be blue.
Once all the properties are set, you can begin digitizing points. Tablet digitizers use the puck to digitize and image digitizers use the mouse. Everyone uses the mouse for dialog actions. If you are digitizing an image and want to zoom in to see the image more closely, use the mouse scroll bar to zoom in and out.
To digitize the monitoring wells:
-
If you are using a digitizing tablet, move the puck over MW-1 on the tablet and click the digitizing button. If you are digitizing an image, move your mouse so that the cross hair cursor is over MW-1 and click the left mouse button.
-
The Enter Object Data dialog appears with the well name automatically included in the Primary field.
-
Click in the Secondary field and type the groundwater elevation value for this point (88.36).
-
Click OK. The point is drawn in the plot window.
-
Repeat steps 1-4 for each additional well.
Back to Creating Symbols
Next to Drawing the Recovery Wells