button. The Grid Data command requires data points with defined Z values.
Grid Data
Grid files are necessary to create many different map types in Surfer, including contour, image, and shaded relief maps. Data files are typically randomly spaced files, and this data must be converted into an evenly spaced grid before using many of Surfer's features. Grid files are produced in Didger by clicking the Map | Surfer | Grid Data command or by clicking the button. The Grid Data command requires data points with defined Z values.
Note: Log axes are not supported with the Grid Data command. Didger requires that the X and Y minimum values are less than the X and Y maximum values for the project limits.
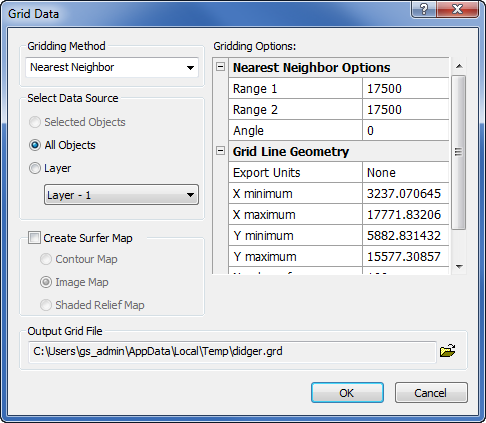
Set the gridding options in the Grid Data dialog.
There are several gridding parameters you can set when producing a grid file. Refer to gridding methods for more information on specific parameters. All gridding methods require at least three non-collinear data points with Z data entered in the Z level field. Available gridding methods include Inverse Distance to a Power, Minimum Curvature, Nearest Neighbor, Radial Basis Function, and Triangulation with Linear Interpolation. To change the Gridding Method, click on the down arrow next to the existing gridding method and select the desired method from the list.
If the desired gridding method is not available, click the File | Export command and export the data points to a DAT file. The DAT file can be used directly in Surfer to grid the data.
The Selected Data Source option controls which data is gridded. Available options are Selected Objects, All Objects, or only the objects on a particular Layer. Selected Objects is not available unless several points are selected before clicking the Map | Surfer | Grid Data command. If Layer is selected, click on the down arrow next to the current layer name to select the desired layer from the project. All layers will be listed.
Check the box next to the Create Surfer Map option to automatically create one of three Surfer map layer types from the new GRD file. After checking the box, select the type of map layer to create. Available map layer types are Contour Map, Image Map, and Shaded Relief Map. If Create Surfer Map is not checked, the map layer type options are not available.
Select Contour Map to create a contour map from the grid file. A contour map is a two-dimensional representation of three-dimensional data. The first two dimensions are the XY coordinates, and the third dimension (Z) is represented by lines of equal value. The relative spacing of the contour lines indicate the relative slope of the surface. The area between two contour lines contains only grid nodes having Z values within the limits defined by the two enclosing contours. The difference between two contour lines is defined as the contour interval.
Select Image Map to create an image map from a grid file. Image maps are raster maps based on grid files. These maps represent Z values (e.g. elevations) with user specified colors.
Select Shaded Relief Map to create a shaded relief image map from a grid file. These maps use colors to indicate the local orientation of the surface relative to a user-defined light source direction. Didger determines the orientation of each grid cell and calculates reflectance of a point light source on the grid surface. The light source can be thought of as the sun shining on a topographic surface. Portions of the surface that face away from the light source reflects less light toward the viewer, and thus appear darker.
|
|
|
|
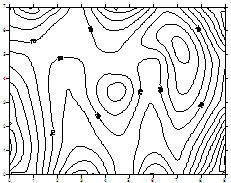
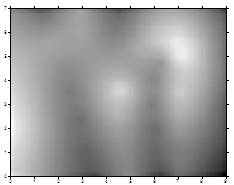
These maps were created using the Grid Data command in Didger. The map on the left is a contour map,
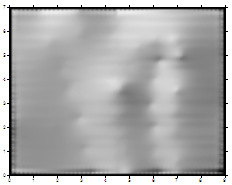
the middle map is an image map, and the map on the right is a shaded relief map.
The Gridding Options section contains the specific Gridding Method options and the Grid Line Geometry section. The first section identifies the properties needed to create a grid using the specified Gridding Method. For instance, if you choose Nearest Neighbor in the Gridding Method list, then the Nearest Neighbor options section appears in the Gridding Options section. To see the options, click on the  next to the option name to expand the section. Highlight any values and type new values to change the value or click on the option to view a list of available options.
The Grid Line Geometry section contains the grid limits and density parameters for the grid. To see the options, click on the next to the Grid Line Geometry text to expand the section.
The Export Units contains the units that should be used for the grid. Click on the cell to the right of Export Units and select one of fourteen different unit options from the list.
The X minimum, X maximum, Y minimum, and Y maximum values contain the coordinate extents of the grid. To change a value, highlight the existing number and type the desired coordinate value.
The Number of rows and Number of columns contain the grid density. Grid density is a measure of the number of grid nodes in the grid. The # of nodes in the X direction is the Number of columns, and the # of nodes in the Y direction is the Number of rows. By default, both directions are assigned 100 grid nodes. To change a value, highlight the existing number and type the desired coordinate value.
Choose a path and file name for the grid in the Output Grid File section. Click the  button to open the Save As dialog, where you can select a new directory and enter a new file name. The file is saved as a Surfer Grid .GRD file.
The default location for the new grid file is the user AppData temporary directory, which is c:\Users\<username>\AppData\Local\Temp, by default. The default file name is didger.grd.
Click OK to create the grid and optional Surfer map. Click Cancel to end grid creation without creating the grid.
See Also